
In the previous parts of this series, we introduced the architecture of our monitoring system, focusing on the edge computing server that enables rule-based automation. We also explained how the system collects and stores data from various sensors and tools. The main advantage of this approach lies in its flexibility—rules can be updated without writing code—and its ability to preserve all sensor data for historical reference.
In this final section, we focus on data visualization and interactive dashboards, which help uncover hidden patterns in production environments and provide operators with intuitive, actionable insights. We also explore how remote dashboards enable control over isolated tools, improving both safety and operational efficiency.
To visualize data, we used Grafana, a widely adopted open-source tool known for its easy deployment via Docker and rich plugin ecosystem. Grafana’s parent company also offers complementary tools like Loki, which collects and processes log files from production tools, sending structured insights to the Grafana dashboard. This combination reduces surprises on the production floor and shortens the response time across multiple teams, especially when many tools are managed by different departments.
Grafana works slightly differently than the rest of the stack. While the edge computing server (Node-Red) handles real-time processing and decisions, Grafana connects directly to the database, fetching and visualizing data without needing to pass through Node-Red. This direct connection allows it to pull from multiple data sources independently and with high flexibility.
Here are several real-world use cases we implemented to address our client’s specific needs:
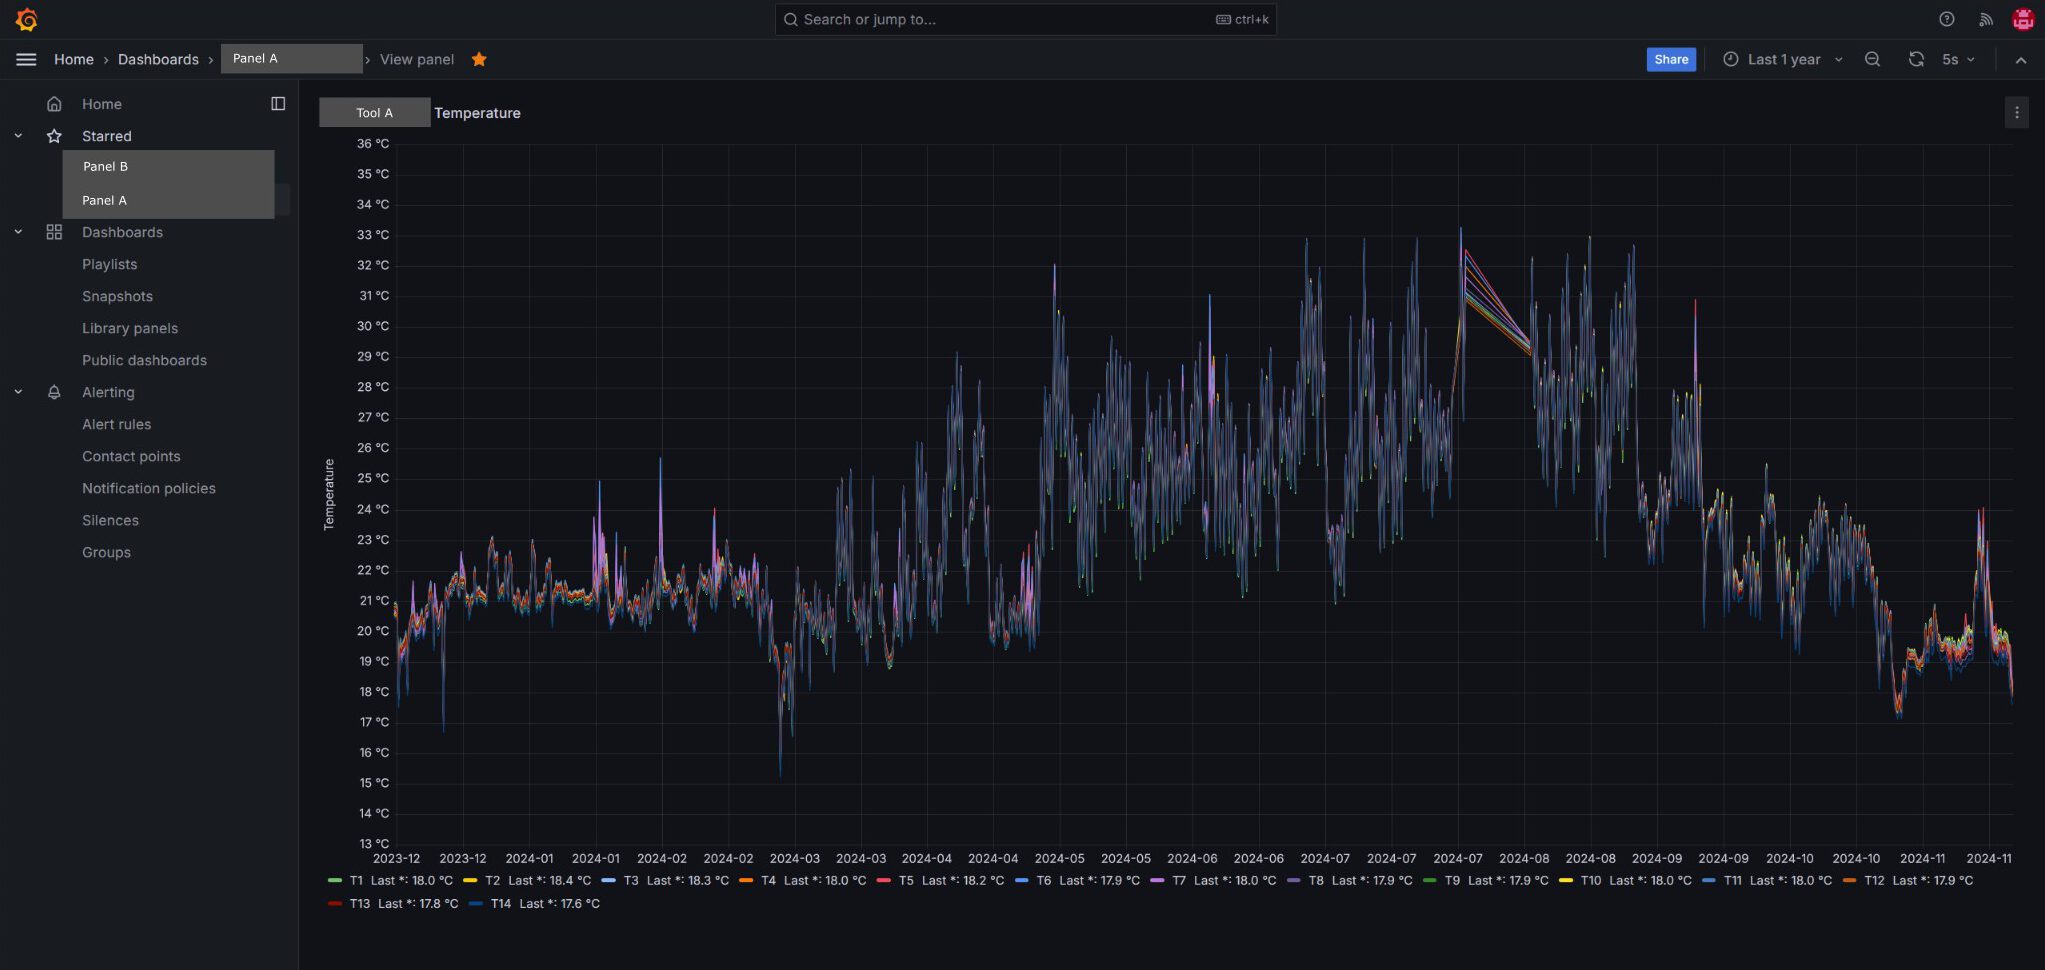
Real-time Monitoring of Ambient Temperature and Humidity
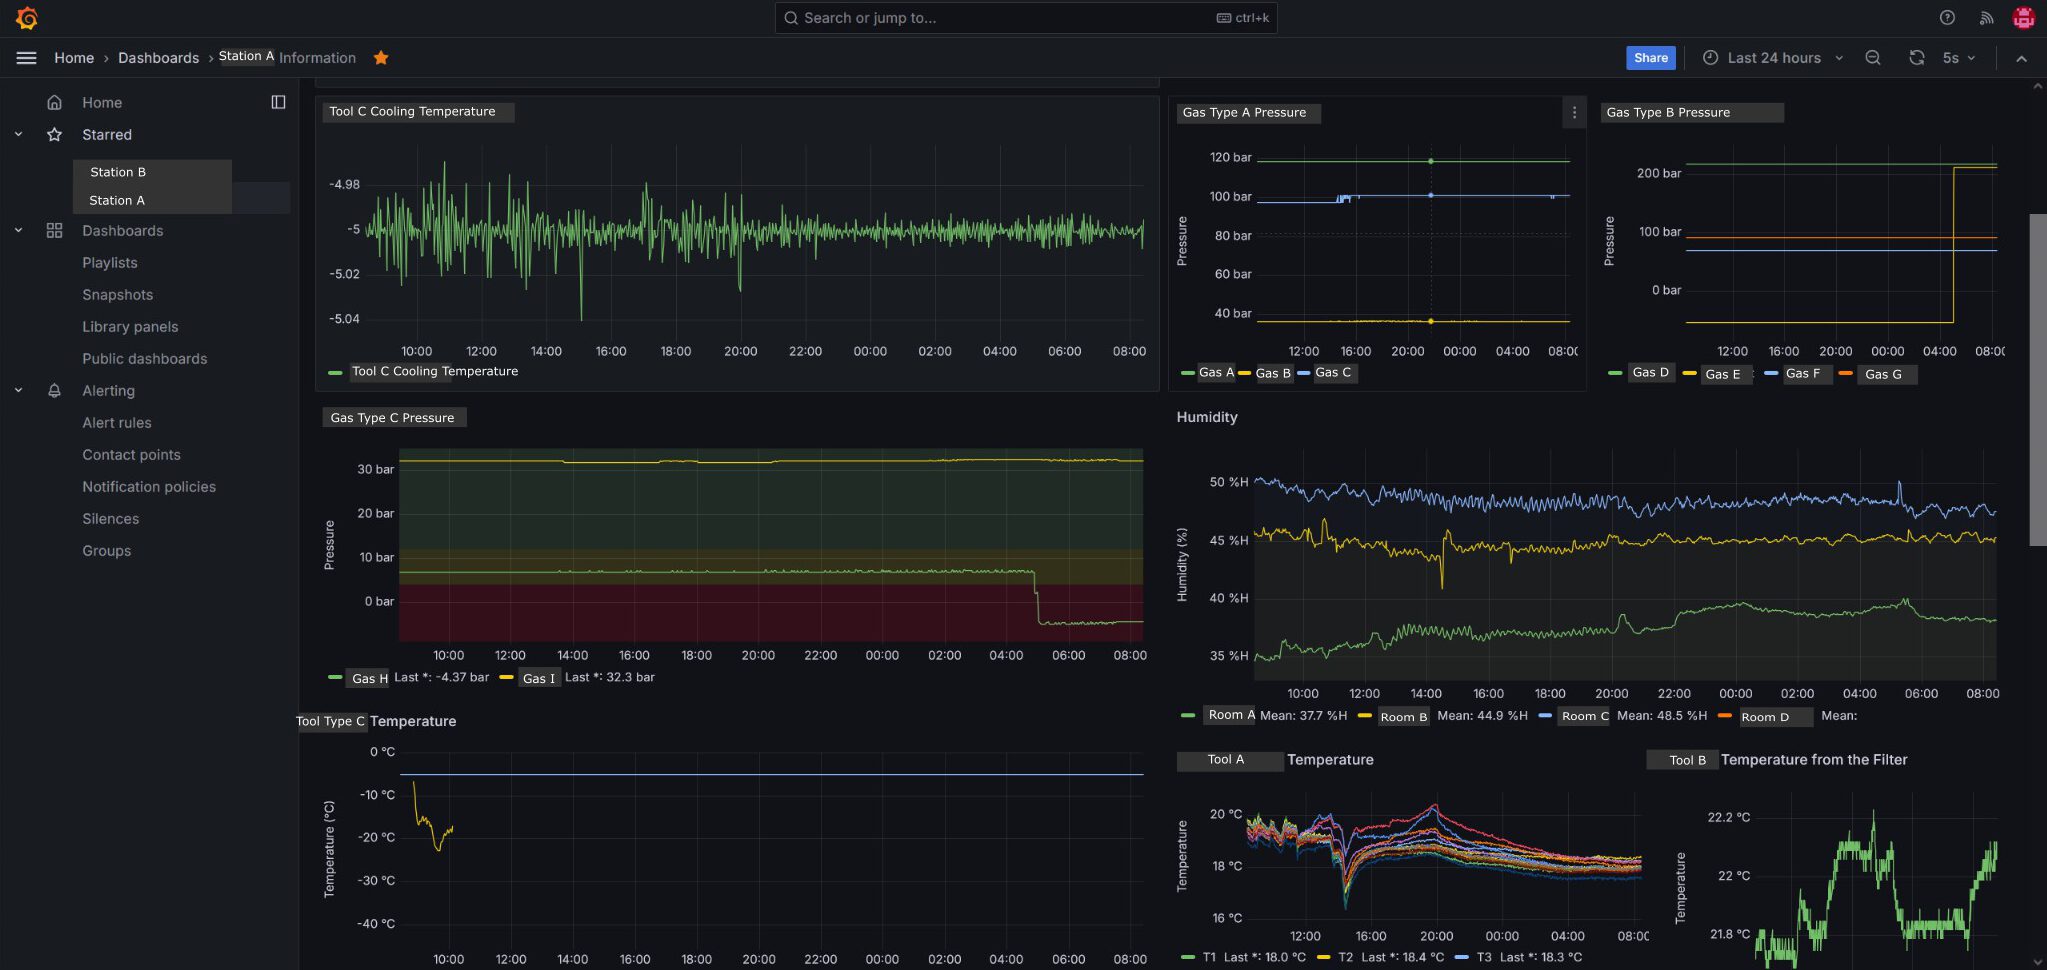
For accurate tool calibration, the production environment required tightly controlled conditions. Real-time graphs showing temperature and humidity were created and shared with the technical building team, enabling them to act immediately if conditions went out of range.Monitoring the Status of Critical Consumables
The most vital consumables were toxic gases, stored in pressurized bottles located in a separate safety area. Running out of gas mid-process would cause tools to halt and go into safe mode, ruining entire production batches—sometimes months of work. By tracking bottle pressure in real-time and marking safe and critical thresholds on the graph, we helped the client avoid these costly disruptions.Tracking Tool Operation Time
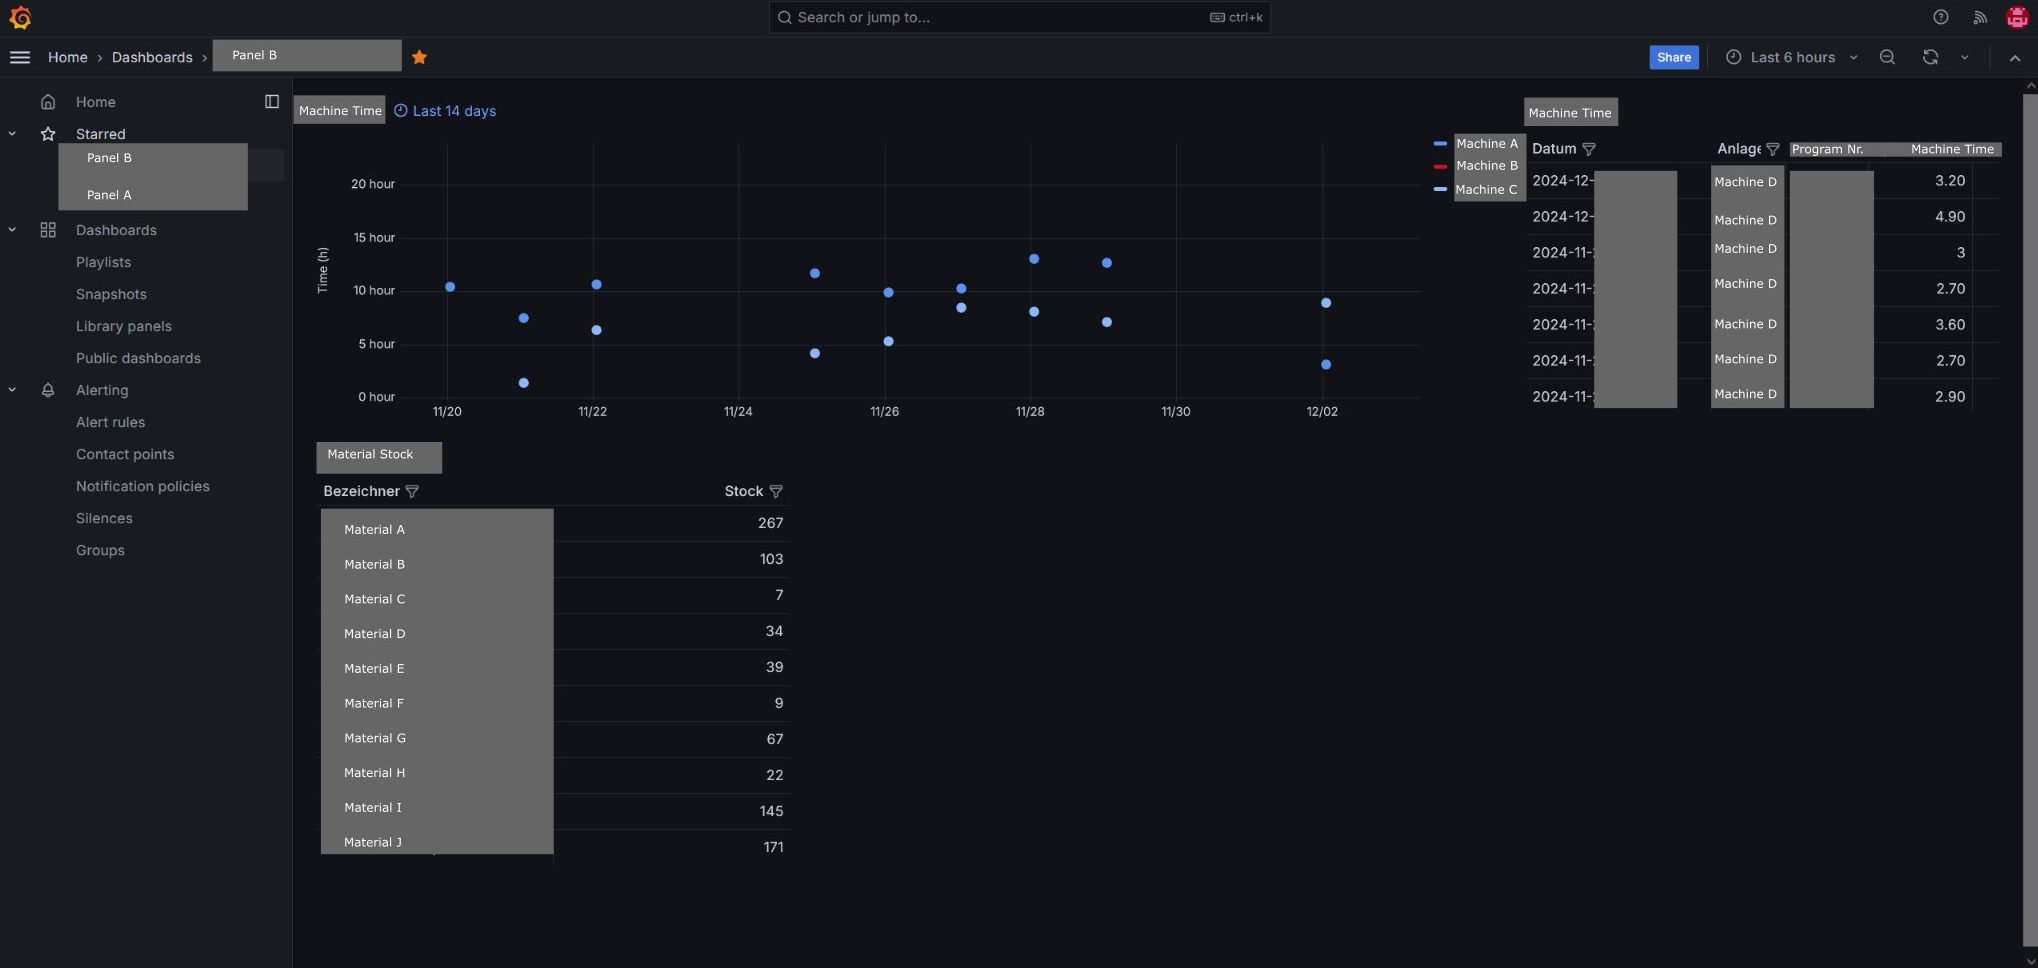
To evaluate tool performance and identify downtimes, we built dashboards that showed daily operating hours. This data was pulled from log files stored on tool computers and served as a transparent way to keep management and other departments informed about tool availability and usage.Consumables Stock Tracking and Forecasting
Consumable levels were manually entered into an Excel sheet and imported into the system. Grafana then visualized stock levels and used basic forecasting calculations to estimate how long the current stock would last, based on current consumption trends. This gave the purchasing team the insight they needed to plan ahead and prevent shortages.Learning Behavioral Patterns and Preventing Failures
With over three years of collected data, we were able to analyze historical patterns that preceded tool failures or infrastructure issues. By comparing past data with failure events, we identified early warning signs. These insights were then fed back into the system by creating new rules and alerts in Node-Red, allowing preemptive actions. Similarly, analyzing consumption rates helped teams know exactly how long each consumable lasted, allowing proactive reordering.
In all of these cases, Grafana provided our client with clear, actionable visualizations, freeing up operators to focus on critical tasks and enhancing overall process control.
Finally, we implemented interactive dashboards using Node-Red’s built-in UI builder. While the majority of the system was built around data collection and alerts, there was also a need for user input and remote control. Node-Red made it easy to create custom web-based interfaces with buttons, gauges, lists, and tables.
This was particularly useful in our client’s setup, where multiple tools were placed in isolated areas due to safety regulations. In case of emergency, fast action was crucial. The Node-Red dashboard enabled remote control of these tools directly from the production area, significantly reducing operator travel time and allowing technicians to safely and instantly control tool settings or shutdowns from a central location.
With this final layer of visualization and interactivity in place, we successfully delivered a complete, modular, and intelligent IoT monitoring stack tailored to our client’s production environment. The system is already proving its value by enhancing uptime, improving decision-making, reducing waste, and giving operators and managers the clarity they need to run a smooth operation.